
Building a Force Analysis Tool for Horizontal Rope Access
- TTRS Configuration · Vortex AHD Leg Forces · Exit Zone Analysis
- SPRAT Level 2 Required Skill · Pre-operational Planning Tool
Moving a package horizontally across a span — a patient in a litter, a gear load, a confined space casualty — sits at the intersection of some of the most demanding geometry in technical rope rescue. Unlike a straight vertical lower, a cross haul asks both anchor systems to work simultaneously, in coordination, across a distance where the interior angle of the rope system changes continuously. Forces shift. Resultants rotate. And the system that looked straightforward on a whiteboard reveals its complexity the moment the package leaves one side and begins its traverse.
This article documents the development of the Cross Haul System Calculator — an interactive, browser-based force analysis tool built specifically for pre-operational planning of cross haul operations using a TTRS (Two Tensioned Rope System) configuration with Vortex AHD (Aluminum Head Device) anchors. It is part of the ongoing force analysis series at Rigging Lab Academy, following the Highline Force Analysis and Anchor Calculator tools published in this journal. The calculator is embedded at the end of this article and freely accessible for use in pre-op briefings and training.
1. What Is a Cross Haul System?
A cross haul system — also called a two-rope offset system — is a rigging configuration that moves a suspended package horizontally across a void, gap, gorge, or structural opening without requiring a pre-tensioned highline rope. Where a highline relies on a rope held under high tension across the span to carry the load, a cross haul uses two independent lowering and hauling systems, one on each side of the void, that coordinate to move the load across by paying out rope on one side while taking in rope on the other.
The practical advantage is significant. A highline requires careful tensioning, sag angle management, and carries the geometric penalties of near-horizontal rope — high anchor forces that scale nonlinearly as the rope flattens. A cross haul sidesteps this entirely. The ropes are never running horizontally across the span under a static tension. They are always angled downward to the load, and the load moves because one side actively lowers while the other actively hauls.
This is listed as a SPRAT Level 2 required skill in rope access training. In the rescue context, it is one of the primary tools for patient movement across confined spaces, building voids, canyon crossings, and industrial structures. The source material for this calculator is a technical overview produced by Elevated Safety, which provides a detailed walkthrough of the system’s rigging, connections, and operational considerations.
2. The TTRS Foundation
The cross haul system in this calculator is built on a Two Tensioned Rope System (TTRS) configuration. This is a specific and important distinction from older mainline-belay architectures, and it is one that has fundamentally reshaped how rope rescue and rope access professionals approach redundancy, load distribution, and system behavior.
In a traditional mainline-belay system, one rope bears the load and one rope sits slack, catching only in the event of a failure. The belay line contributes nothing to the working load under normal conditions. The TTRS inverts this: both ropes are tensioned, both are load-bearing, and both are capable of functioning independently as either the working line or the backup to the other.
In the cross haul context, this means two tensioned ropes per side — four ropes total. Both ropes on the left side run from the left anchor to the package. Both ropes on the right side run from the right anchor to the package. There is no belay designation. Every rope in the system is a working line.
|
Why TTRS changes the cross haul Force is distributed across two ropes per side, reducing load per component. If one rope fails, the remaining rope on that side immediately assumes full load without drop or shock — because it is already tensioned and already engaged. Rope stretch is minimized. Belayer complacency is eliminated. And system symmetry is maintained, since both sides are rigged identically. The TTRS represents a convergence of rope access efficiency and rope rescue redundancy principles that has been gaining adoption for more than a decade. |
3. The Geometry That Drives the Forces
To understand the forces in a cross haul, you need to understand two independent variables that define the position of the package at any moment: its X position (horizontal location across the span) and its Y position (vertical height above the gorge floor). These are not linked. They move independently, and the operations that move them are different.
X movement — horizontal traverse
To move the package horizontally, one side hauls while the other lowers at an equal rate. If the left side hauls and the right side lowers, the package moves right. The load stays at the same vertical height. The ropes on each side change length, and the angles change accordingly. This is the core traverse motion.
Y movement — vertical height
To move the package vertically, both sides act in the same direction simultaneously. Both sides haul together — the package rises. Both sides lower together — the package descends. Exit is achieved when Y reaches anchor height — the package arrives at the cliff top level where it can be transferred to the receiving team.
The interior angle and the 90° rule
The interior angle is the angle at the package between the two rope segments — one running to the left anchor, one running to the right. This angle is governed entirely by the X and Y position of the package relative to the anchor heights.
At centre span with good anchor height, the interior angle is typically 60–90°. At 90°, each side carries approximately 70.7% of the total load weight — the well-known √2/2 result. At 120°, each side carries 100% of the load weight. Beyond 120°, each side carries more than the full load — force multiplication begins and anchor demands escalate rapidly.
|
The 90° operational guideline Keep the interior angle at or below 90° throughout the traverse. This keeps each side’s anchor load below 71% of the total load weight, providing meaningful margin over a 50:50 symmetric split and staying well below the 120° threshold where force multiplication begins. The calculator shows the interior angle live and flags when it approaches and crosses the 120° threshold. |
4. What the Calculator Actually Models — and What It Does Not
This is the most important section to read before using the tool. The calculator solves static equilibrium — the forces at any given X/Y position assuming both sides are locked off and the package is stationary. These are the correct values for anchor sizing, component selection, and MBS verification. They represent the worst-case static load that position could impose on each anchor.
What the calculator does not model is real-time tension during active traverse. When one side is hauling and the other is lowering, the actual tensions on each rope are controlled by the operators through their descent control devices (DCDs) — not purely determined by geometry. Field research on TTRS systems shows that tension distribution during active movement ranges from 80:20 to 20:80 between the two sides, and everything in between. The geometry-based forces shown in this tool are not the instantaneous forces on a moving system.
A specific consequence of this is the wide angle near an anchor. When the package is close to one anchor — at the start or end of a traverse — the far rope spans nearly the full width of the gorge and flattens out, producing a wide interior angle (sometimes 120° or more). The calculator shows this as a potential warning. But operationally, this is expected geometry at that position — the far side’s rope is in a lowering role and the far side team is controlling its tension through their DCD. The anchor force on the near side is low (because the near rope is nearly vertical), and the far side’s actual tension is operator-managed, not geometry-driven. The alert system in this calculator evaluates force against WLL, not angle alone, to avoid false alarms at near-anchor positions.
The calculator also does not model:
- Dynamic loads — arrest events, sudden stops, or shock loads from a falling or swinging package can produce forces two to four times the static values.
- DCD friction losses — real-world haul efficiency through MPDs, Maestros, and Clutches is typically 20–30% less than the theoretical ratio due to device friction, rope stiffness, and carabiner geometry.
- Rope stretch — under load, the rope geometry changes. The sag angle and package position shift as stretch settles out.
- Terrain asymmetry — one side of a traverse may run over an edge, through a guide, or across friction points that change the effective load distribution between the two systems.
— Interactive Calculator —
Use the sliders to set X position, Y height, load, span width, anchor height, MBS, and safety factor. The canvas updates in real time. Expand the Vortex AHD section at the bottom to see leg force analysis. The model scope panel at the top explains what the calculator does and does not model.
5. The Vortex AHD — Where the Forces Land
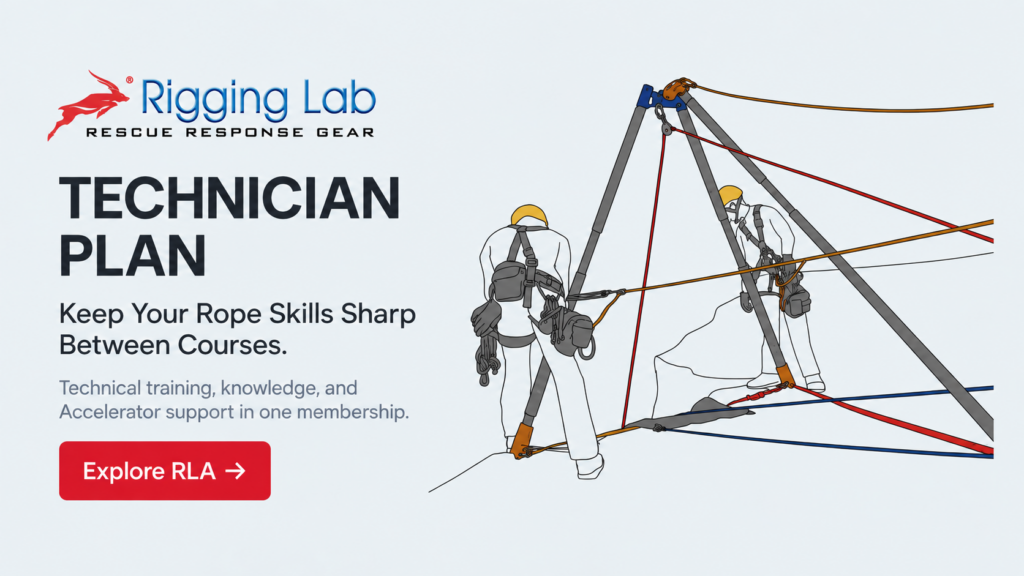
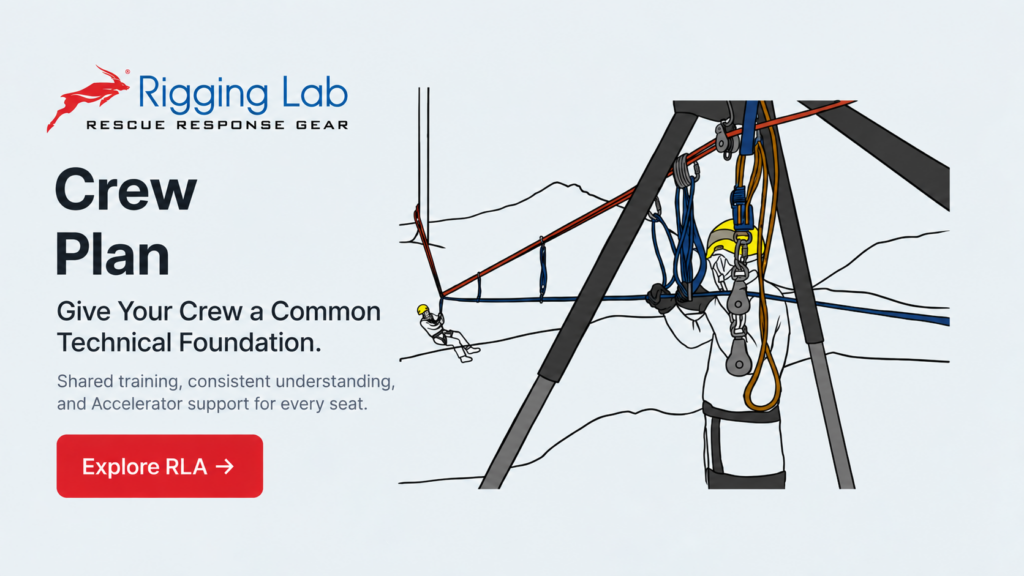
In the cross haul configuration shown in the source video and modeled in this calculator, each anchor point is the apex of a Vortex AHD — an aluminum head device configured as an A-frame easel. The Vortex is widely used in rope rescue and rope access as a portable artificial high directional, providing a stable elevated anchor point where no natural anchor exists at the correct height or location.
The critical geometry to understand is this: the Vortex apex is the anchor point — not the cliff edge, and not the leg feet. The apex floats above the cliff top surface. The two front legs splay forward toward the gorge edge and plant their feet on the cliff top surface. The rear leg extends backward onto the cliff top surface behind the apex. The TTRS ropes run from the apex downward into the gorge to the package.
Front legs — compression
The two front legs are in axial compression. The rope load pulls the apex forward and downward into the gorge. The front legs resist this by pushing backward and upward — transferring the load into the cliff top surface at their feet. The compression force in each front leg is calculated from the apex load and the leg lean angle (how far the front legs tilt toward the gorge).
Rear leg — base anchor in tension
The rear leg resists the forward tipping moment. As the resultant at the apex pulls forward (toward the gorge), the rear leg is stretched — or more precisely, its base anchor connection is placed in tension. The tube of the rear leg is the same aluminum component as the front legs. The distinction is in the loading direction and the base connection: the rear leg base anchor must resist a tensile pull as the apex tries to tip forward under load. This is what the calculator marks with the (▲) symbol at the rear foot.
Lateral component — the rotating resultant
As the package traverses in X, the resultant force at each apex rotates. At center span, both resultants pull relatively symmetrically inward and downward. As the package moves toward one anchor, that anchor’s rope approaches vertical (low force, near-vertical direction) while the far anchor’s rope flattens and the resultant gains an increasingly lateral component.
This is why guy wires on the lateral axis must be pre-rigged before the operation begins, not improvised as the package moves. The worst-case lateral load direction is not at center span — it is at the extremes of the traverse, when the package is close to one side and the far rope is pulling the far apex strongly inward across the span. The calculator provides a qualitative lateral component description that updates live as the X slider moves.
6. Exit Zone — The Most Critical Phase
The exit zone is defined as the final portion of the haul where Y approaches anchor height — the package is rising toward the cliff top level where it will be received. The calculator flags entry into this zone at 60% of anchor height and escalates warnings at 85%. This is operationally the most demanding phase of the entire cross haul for several compounding reasons.
Force spike
As Y approaches anchor height, the vertical distance between the anchors and the package shrinks. The ropes approach horizontal at the anchor end, and the tension required to support the load increases. At very shallow angles, small changes in Y produce large changes in force. The final meters of haul carry the highest static forces of the entire operation. The calculator shows this numerically — watch the apex force values as you drag the Y slider toward anchor height.
Vortex tip-forward risk
As Y rises and the resultant becomes more horizontal, the forward moment on the Vortex apex increases. The rear leg base anchor tension spikes. This is the moment when the rear anchor — often a stake, a rock anchor, or a rigging plate — is carrying its maximum load. This capacity must be verified before the package enters the exit zone. It cannot be improvised at the edge.
Handoff dynamics
The transfer of the package from the TTRS to the receiving team at the cliff edge is a moment where neither system has full control of the load. The TTRS is releasing as the receiving team takes the weight. This transition must be pre-briefed, assigned, and practiced. It should not be improvised at the edge with a fully loaded system overhead.
Rope control degradation
As the rope angles flatten near exit, the mechanical relationship between rope movement and package movement changes. Small amounts of rope paid out or taken in produce larger package movements than they would at lower Y positions. Teams must slow their haul rate, increase communication, and ensure neither side goes slack — a sudden slack-side event near exit can produce a lateral swing that is difficult to control.
|
Exit zone operational checklist Before entering the exit zone: (1) Confirm rear leg base anchor capacity on both Vortex units. (2) Pre-brief the handoff with receiving team assigned and positioned. (3) Slow haul rate on both sides. (4) Confirm guy wire pre-rigging for worst-case lateral direction. (5) Communicate continuously between left team, right team, and package attendant. The calculator provides force values — the checklist is your operational bridge to those numbers. |
7. Using the Calculator in Pre-Op Planning
The calculator is designed for use in pre-operational planning — the briefing room, the training session, the site survey. Here is a worked example showing how to move from field conditions to component ratings.
Step 1 — establish the geometry
Set span width and anchor height from field measurements. For a 30 m span with Vortex anchors at 20 m above the gorge floor, these become the base inputs. The canvas immediately shows the package path and the rope geometry at any X/Y position.
Step 2 — set the load
Enter patient weight, rescuer weight, and equipment — the load slider defaults to 185 kg as a conservative rescue load. Adjust to match your actual package weight. Note that this is the static load — dynamic multipliers for arrest events or shock loads are not included and must be considered separately.
Step 3 — enter the weakest component MBS and safety factor
The WLL is calculated as MBS divided by safety factor. The tool defaults to 30 kN MBS at 10:1 — a 3 kN WLL. Set your weakest in-system component and your organization’s required safety factor. The margin card immediately shows how much headroom you have between peak static force and WLL. If the margin is negative, the geometry, load, or component ratings need to change before the operation proceeds.
Step 4 — traverse the package
Drag the X slider from one side to the other at a representative Y position. Watch how left and right apex forces change. The resultant arrows on the canvas show direction and relative magnitude. This is the single most valuable exercise the calculator provides — seeing the force distribution shift in real time across the full traverse gives teams an intuitive understanding of which positions carry the highest loads and which anchors are under the most stress at which moments.
Step 5 — raise to exit and verify
With X at center and Y rising toward anchor height, watch for the exit zone warnings. Verify that peak forces at the expected exit position stay within WLL. Then open the Vortex AHD section and check front leg compression and rear anchor tension values against the Vortex’s rated component capacities. Adjust front leg lean angle and rear leg angle to match your actual configuration.
What to bring to the briefing
From this tool, the pre-op briefing should document:
- Peak apex force at worst-case position — the highest force either anchor sees across the full traverse.
- WLL and margin — confirmation that peak force stays below WLL with the required safety factor.
- Exit zone entry force — the apex forces when Y reaches 60% and 85% of anchor height.
- Vortex front leg compression and rear anchor tension — verified against rated capacities.
- Lateral component direction — which direction the guy wires must resist at the extremes of the traverse, and confirmation they are pre-rigged accordingly.
8. Limitations and What Comes Next
The calculator is a planning tool. It is not a substitute for field verification, qualified rigging assessment, or the judgment of an experienced operator who can see the actual terrain, hardware condition, and team capability.
The most significant gap between this tool and field reality is the absence of dynamic force modeling. A load cell in the system during tensioning and operation will show forces that the static calculator cannot predict — particularly during the stop-start movements of a coordinated traverse, where each haul-pause cycle produces a small dynamic spike, and any sudden stop or catch produces a larger one. For operations where the static forces are already close to WLL, direct load cell measurement is not optional.
The tool also models both anchors at the same height, and the AHD leg force analysis is two-dimensional. Real Vortex installations have three-dimensional geometry, and the lateral component of the apex load loads the front legs asymmetrically in ways this calculator cannot fully represent. The qualitative lateral component description in the AHD section is intended to flag this, not to quantify it.
Future development of this tool may include: independent anchor heights (already partially built in earlier iterations), dynamic load multiplier estimation based on rope mass and arrest distance, and a print-ready summary card for briefing documentation. Feedback from field use is the most valuable input for that development — if you use this tool in a real pre-op briefing and find a gap, we want to know.
This calculator is part of the Force Analysis series at Rigging Lab Academy, which includes the Highline Force Analysis tool, the Two-Point and Three-Point Anchor Calculators, and the Redirect (COD) Pulley Anchor Load tool. Each tool in the series follows the same design philosophy: the math must be correct and transparent, the scope must be honestly stated, and the interface must be usable in the field without a rigging engineer present.
The goal is not to replace expertise — it is to give practitioners at every level a direct, visual connection between the geometry they are building and the forces that geometry creates. Understanding why a 90° interior angle matters, why exit is the highest-force phase, and why the rear Vortex anchor is the tension element rather than the tube — that understanding is what keeps people safe. The calculator is a vehicle for that understanding.
Peace on your Days
Lance