Anchor Angles and Load Distribution
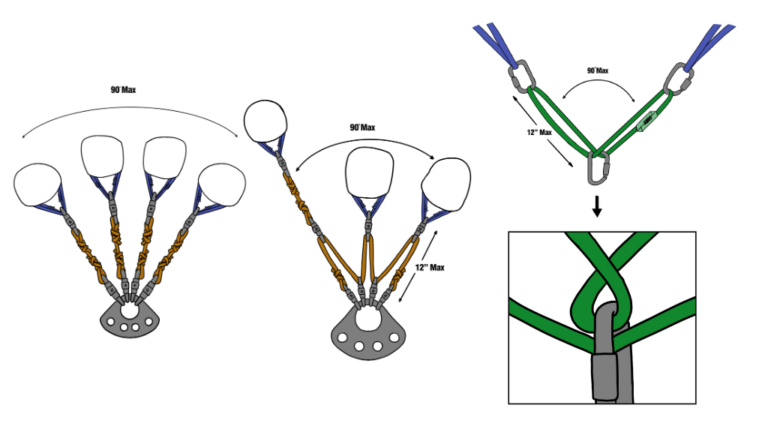
Anchor angles affect how the load is distributed between the legs of a multi-point system. The wider the angle becomes, the more force each anchor leg must carry.
This relationship is central to understanding anchor forces, load relationships, and the effects of vector angles — and it’s a relationship that catches a lot of riggers off guard, because it runs against intuition. Adding a second anchor point feels like it should cut the load in half. Sometimes it does. Sometimes it doesn’t. The angle is what decides.
Scenario: Set the calculator above to a 300 lb load and a 20-degree angle. Per-leg tension reads about 153 lb — barely above the 150 lb you’d expect from splitting the load evenly in half. At a narrow angle, two anchors really do behave like two anchors sharing the work.
The math in one line
Tension per leg = load ÷ (2 × cos(angle / 2))
You don’t need to run this by hand in the field. Use the calculator above, drag the angle slider, and watch the number move. But it’s worth knowing what’s driving it: as the angle between the two legs opens up, each leg has to pull harder just to hold the same vertical load in place. The geometry is working against you, not for you.
Scenario: Keep the load fixed at 300 lb and walk the angle slider from 20° to 60° to 100°. Tension per leg climbs from 153 lb, to 165 lb, to 236 lb. Nothing about the load changed — only the angle did. That’s the entire lesson in one slider drag.
Three numbers worth memorizing
At 90 degrees, each leg carries approximately 71 percent of the load. Set the calculator to 300 lb and 90° and you’ll see 212 lb per leg, 71% of load per leg, right at the edge of the green “within guideline” banner.
At 120 degrees, each leg carries 100 percent of the load. Slide the angle to 120° with the same 300 lb load, and per-leg tension reads 300 lb — the banner has already shifted to amber. The second anchor is no longer reducing the load on either leg at all; it’s just splitting it into two full-strength pulls.
Beyond 120 degrees, leg tension exceeds the total suspended load. Push the slider to 150° and the same 300 lb load now reads roughly 579 lb per leg — the banner turns red. The system still looks like a two-point anchor. The math says each point is being asked to hold nearly double the actual weight.
Why this matters in the field
The diagrams and the calculator above provide a point of reference for comparing different interior angles. Field values may not always be exact — no two anchor setups are identical, and real-world rigging always has some slack, stretch, and imprecision in it. But the observed force relationships have to remain in agreement with the underlying principles. Physics doesn’t grade on a curve for a rushed setup.
Scenario: A crew rigs a 300 lb load between two anchors that are close together and directly overhead, giving a tight 30° angle — the calculator shows 155 lb per leg, comfortably green. Later, to reach a farther anchor point, they widen the spread to 130°. Same load, same crew, same knots — but the calculator now shows 379 lb per leg, into the red. Nothing about the load or the gear changed. Only the geometry did, and the geometry alone pushed both anchors past the original load.
Practical guidelines
- Avoid wide angles whenever possible.
- Keep the critical (field) angle at 90 degrees or less when conditions allow.
- Treat the angle between anchor points — sometimes called the field angle — as a hard ceiling, generally not to exceed 90 degrees.
- Remember: at 90 degrees, each leg carries about 71 percent of the load; at 120 degrees, each leg carries 100 percent.
- Understand and apply multi-point anchor load distribution rather than assuming the load is divided equally.
Scenario: Before committing to an anchor layout, run the actual working load and your planned angle through the calculator above. If the banner is green, the layout is within guideline. If it’s amber, you’re already past 90° and climbing toward full load-per-leg at 120°. If it’s red, the angle itself has made the anchor system carry more than the object weighs — that’s the point to re-rig, not push forward.
Try it yourself
Use the calculator above to test your own numbers. Drag the load slider to match your actual working load, then move the angle slider and watch where the tension crosses from green to amber to red. Seeing the number climb in real time makes the 90/120-degree thresholds stick a lot better than reading them off a chart.