
In Track Lines and Guiding Lines: Forces Based on Point Loads in a Catenary, Stephen Attaway says, “The scope of this paper is limited to providing a better understanding of how to predict sag, tension, forces, and possible hazards.”
This research was originally presented at the International Technical Rescue Symposium (ITRS) in November of 2013, and it grabbed a ton of attention and comments. At some point, everyone becomes a “rigging geek” and when presentations such as this are given, the game is raised for everyone and as they say “rising tides float all boats”. Everyone’s game and boats raised a few notches with this one.
Introduction
Guiding lines, Tyrolean lines, high lines, and other applications of using a rope or cable to span a chasm can be classified as a track line. The original use of a rope in this fashion dates back to the Tyrol Region of the eastern Alps in western Austria and northern Italy, where people used a hand-over-hand method to travel along the rope and across the span. Today, rescuers and mountaineers continue to use these methods in their present forms with better materials and equipment.
The goals of this paper are:
- Show a method for predicting through calculation the rope tensions expected for a rescue load on a high line or guiding line.
- Determine if the method works (build it, measure the loads throughout the system, update the model).
- Use the resulting mathematical model to consider a range of combinations that include loads and geometries.
- Determine if the current rules of thumb as both published and taught in the rescue/high line guidelines are conservative (maybe they are too conservative).
- Determine conditions (loads + geometries) that are unsafe. This paper is not intended to be an overview of how to correctly rig all components of a high line. Assessing the risk versus benefits of all the possible different high line components and configurations is beyond the scope of this paper. The scope of this paper is limited to providing a better understanding of how to predict sag, tension, forces, and possible hazards.
Predicting Track Line Forces
The forces in a track line are well understood if the geometry is known. Predicting the geometry of a track line before the load is applied is not intuitive, due to the non-linear nature of static rope stretch and the large change in angles as the load traverses the span. Without the ability to predict sag, it is impossible to have a good understanding of the forces generated in high lines, guidelines, slack lines, and guided rappels.
The mathematical model will be used to determine if the current rules of thumb (based on linear rope behavior) for rigging high lines are well engineered and lead to safe practices. In the event that the rules of thumb are not predictive and potentially inaccurate for technical rope riggers, the mathematical model can be used to guide the testing that will lead to better rules of thumb.
Theoretical Forces in a Suspended Load for a Given Geometry
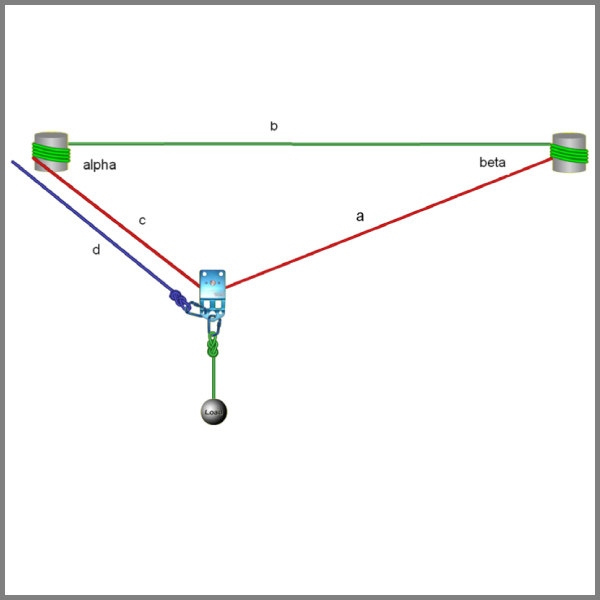
As a first approximation to the forces in a track line, we will assume a rope with negligible weight, where the forces depend only on the high line geometry. The forces in a high line depend on the geometry of the triangle that is formed by the lines connecting the anchor and loads. The final resting geometry depends on rope stretch. Here, we will consider a rope between two anchor points with a span of length b shown in Figure 1.
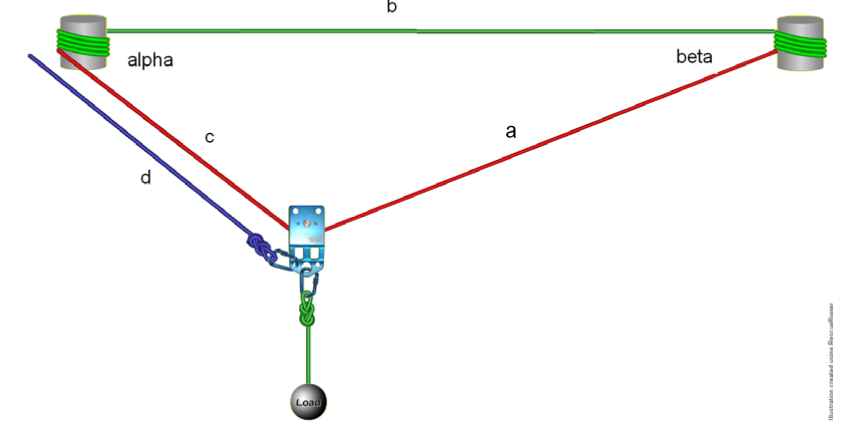
Figure 1. Rope geometry for a stretched high line. (The green rope (b) is only shown for outlining the problem, it is not part of the system)
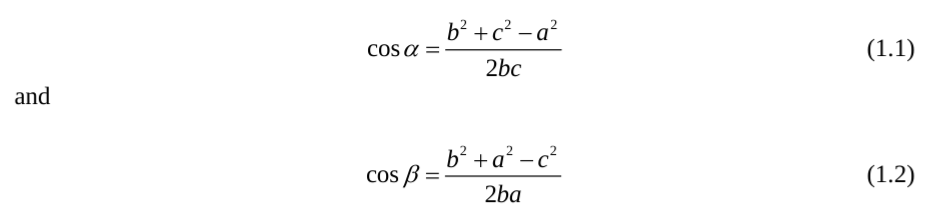
The properties of the triangle formed by sides with lengths a, b, and c are as follows:
The forces in the main line (red) and the tag line (blue) can be computed for static equilibrium based on the sum of forces acting on the pulley in the x and y direction being zero.
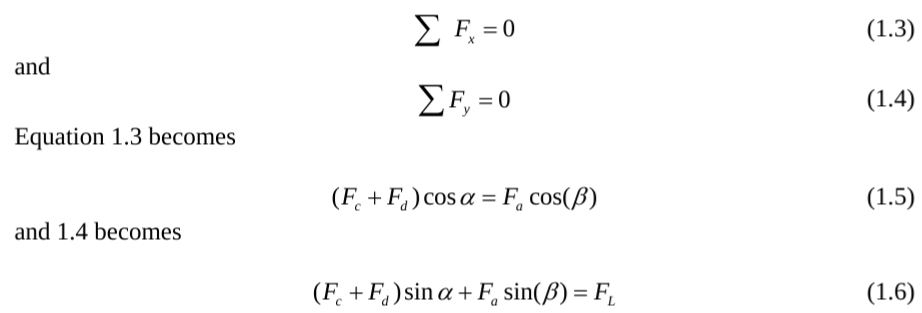
We will assume that the pulley frictional force is zero to have the high line force the same on both sides of the pulley:
![]()
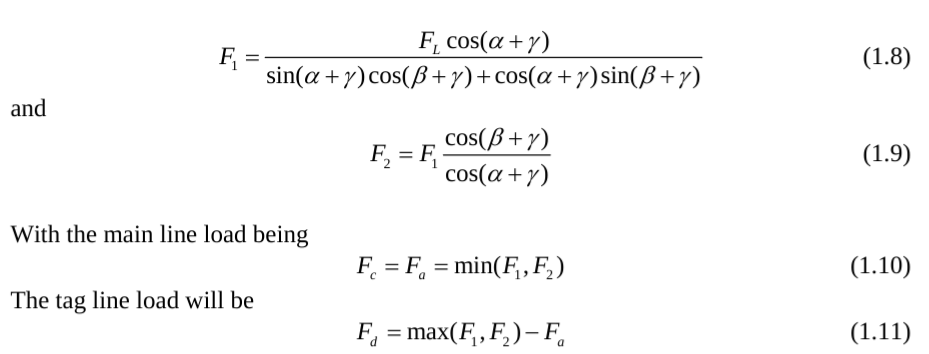
If α and β are known, then the above equations become a linear system of three equations with three unknowns. These equations can be solved by simple substitution or by Cramer’s rule.
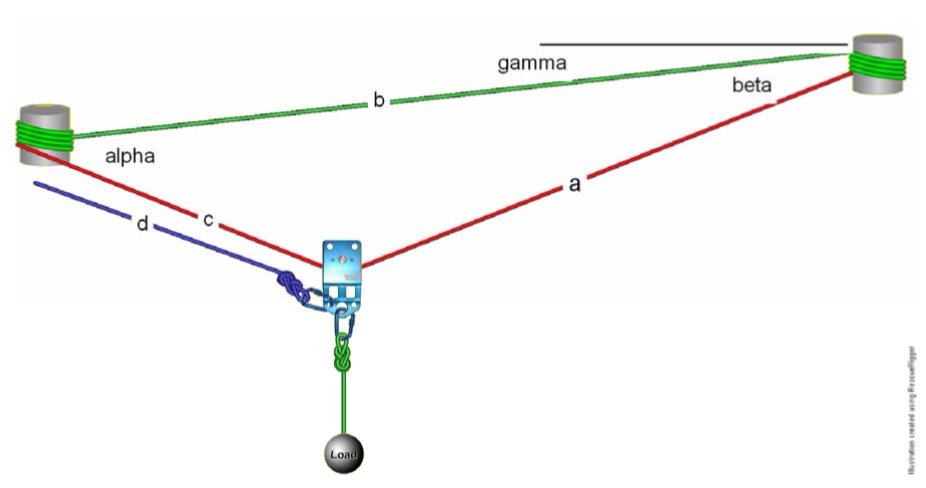
Figure 2. Modified geometry showing slope angle γ (gamma).
A rotation of the high line system can be accomplished by adding a slope to the main line (see Figure 2). If the system makes an angle γ with respect to the horizontal, then the force equations become:
Software packages like RescueRigger can currently compute the loads in rope given the geometry. However, RescueRigger cannot currently compute the loads based on the stretch in the rope. Adding additional weight to the system may significantly change the rope stretch. The rope stretch will change the angles of the high line. Predicting track line behavior is essential for understanding high line construction and design system margins.
Predicting Track Line Geometry from Rope Stretch
In this section, the method for computing the deformed shape of the high line system will be outlined. The basic algorithm is to first compute the force in the main line without rope deformation. These main line forces are then used to compute an estimate of stretch in the main line. The geometry is updated, new forces are computed, and a better estimate of stretch can be used to solve for a new geometry. Continue this feedback/update until the forces and geometry converge.
The amount of deflection will depend on the load and the total rope length, L. The rope length can be computed from the initial length of the rope plus the rope stretch. Once the tension in the main line is known, the stretch in the rope can be computed.
Static nylon rope does not have a linear force elongation curve (Attaway, 2002). The force elongations curves used in this study are shown in Figure 3.
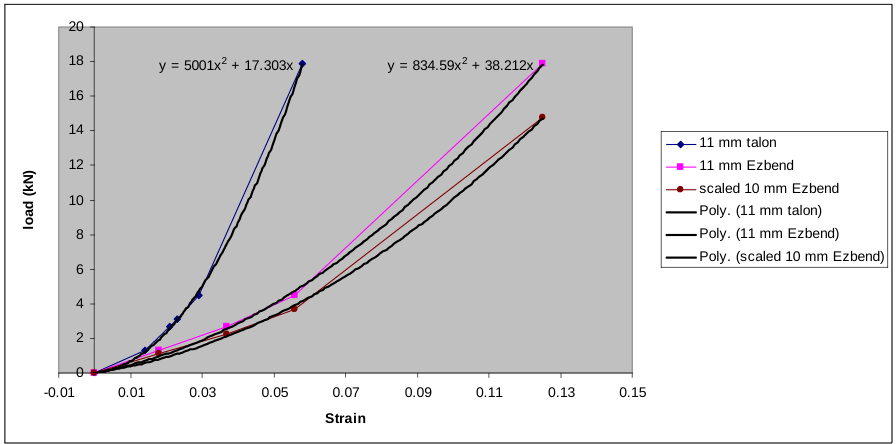
Figure 3. Force-elongation curves used in this study with polynomial for different ropes. See (Attaway, 2002).
For a static rope, the force, F, as a function of strain, is assumed to have the following form:
![]()
Here, ka and kb are constants determined from a least squares fit of pull test data for force as a function of elongation. A second order polynomial with a zero intercept was used to fit rope pull data. A second order fit follows the path reasonably well. However, some error at loads below 1 kN is clearly present. A higher order polynomial fit may be warranted.
Using Eq. 1.12 gives the force as a function of displacement as:
![]()
One may account for the tension pre-loading by changing (shortening) the rope length and adding an additional constant elongation to Equation 1.17. For the case of no pre-loading, rope slack can be added based on the initial rope length selected.
Predicting Rope Deflection Based on a Catenary Curve
A catenary is the curve that an idealized hanging chain or cable assumes under its own weight when supported only at its ends. For short systems, the catenary effect may not be important. For long systems, however, curvature of the rope and the rope weight may become important. Using a catenary allows us to compute the unloaded sag in the rope due to the weight of only the rope.
The problems of the catenary are generally treated in texts on Mechanics. Power lines and phone line designs require an understanding of the cable forces and sag. Numerous numerical solutions exist for catenary forces and displacements. Early studies for tensions in track cables and logging skylines provided solutions for a catenary loaded at one point (Anderson, 1921).
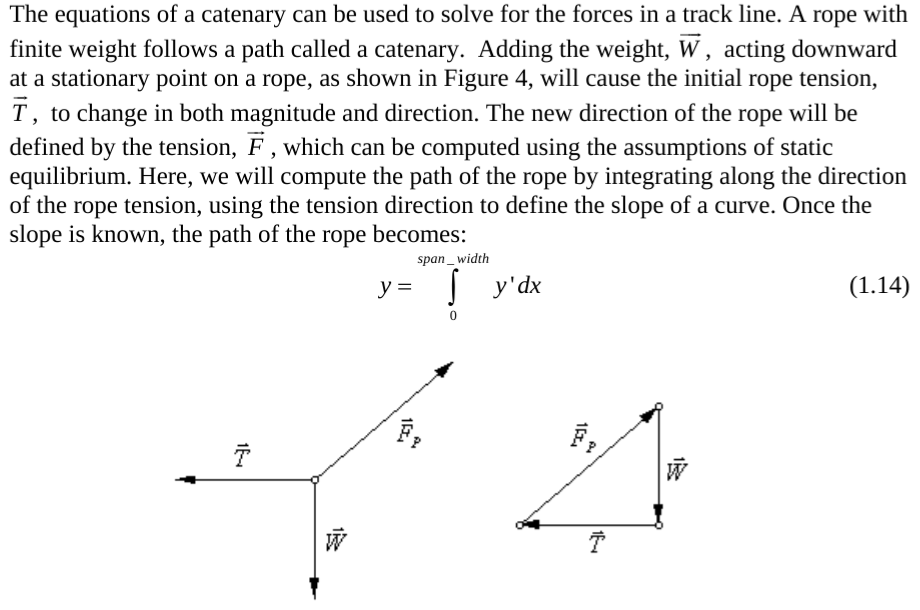
Figure 4. Tension forces and directions for rope.
In order to evaluate the forces in a high line, the initial tension and initial slope of the rope will need to be defined at the beginning of the integration. In general, the span length and span angle are known, but the initial rope slope will be unknown. The approach taken here was to set the initial slope to zero and select a tension at the first anchor. The resulting path integral will define an end point y, which can then be used to compute a span angle. The initial angle can be updated iteratively based on the difference between the desired span angle and the computed span angle. This method was found to be robust for track lines with slopes of less than 45 degrees.
Solution of Rope Stretch Combined with a Catenary
Defining the initial slope and tension is not sufficient to solve for the equilibrium position of a track line system. In order to solve for the equilibrium position, the rope stretch must be considered. An additional constraint placed on the catenary is that the stretched rope be equal to the length of the path prescribed by the catenary and its boundary conditions.
The length of the stretched rope can be computed based from the rope tension.
The solution for the tension that solves the zero function can be found using the bisection method (Liengme,1998).
Example and Verification of Model
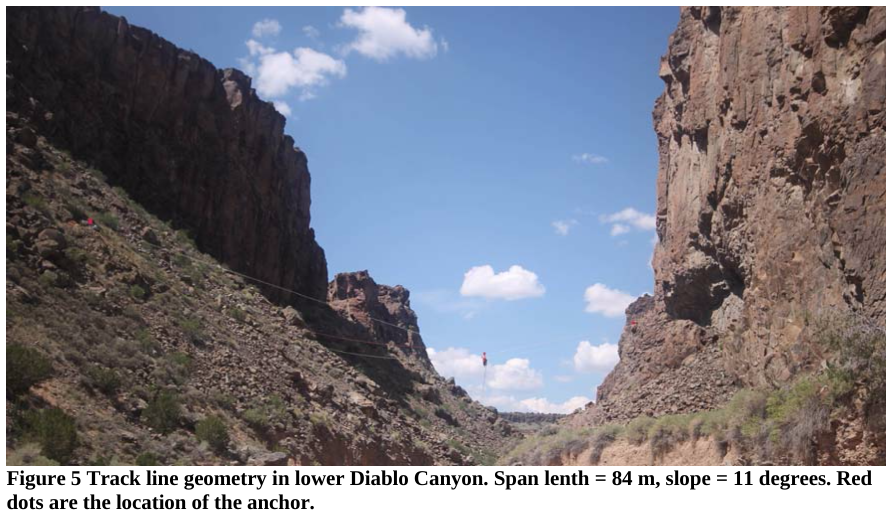
All mathematical models are incomplete based on the limited assumptions that are employed in their construction. Therefore, model verification is necessary to ensure that the model will work for its intended uses. In order to test the second order fit for rope stretch with the catenary, a span was selected in Diablo Canyon, north of Santa Fe, New Mexico. A span width of 84 meters with an 11 degree slope between anchors was loaded with a test mass of 0.95 kN. The geometry is illustrated in Figure 5.
Method
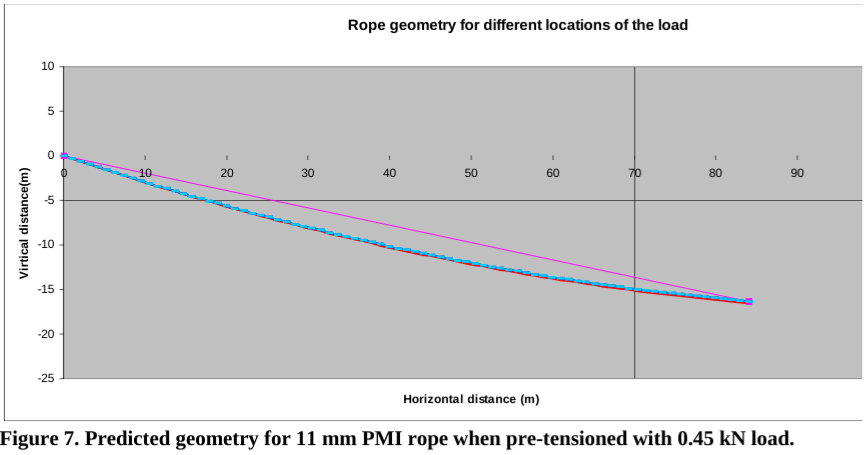
The track line was pre-tensioned with 0.45 kN (100 lbs) before the test mass was moved across the canyon. Bolted anchors were used on each end of the track line. Full strength anchors were constructed using bollards.
Given the 1) length and 2) angle of the span, the 3) length and 4) angle to the load, and the 5) load, the tension can be computed. A Hilti PD42 range finder was used to measure distance from anchor to load. The range finder was accurate but difficult to use due to sunlight overpowering the laser spot. Angles were measured with a Macintosh iPhone 4S using Theodolite 3.2 Hunter Research & Technology LLC software. Figure 6 shows the results of angle and distance measurements compared with load cell measurements. The distance and angle were measured at one anchor only. As the load moves father away from the anchor, errors in angle measurements become larger. Small errors in angle measurements can lead to large errors in load.
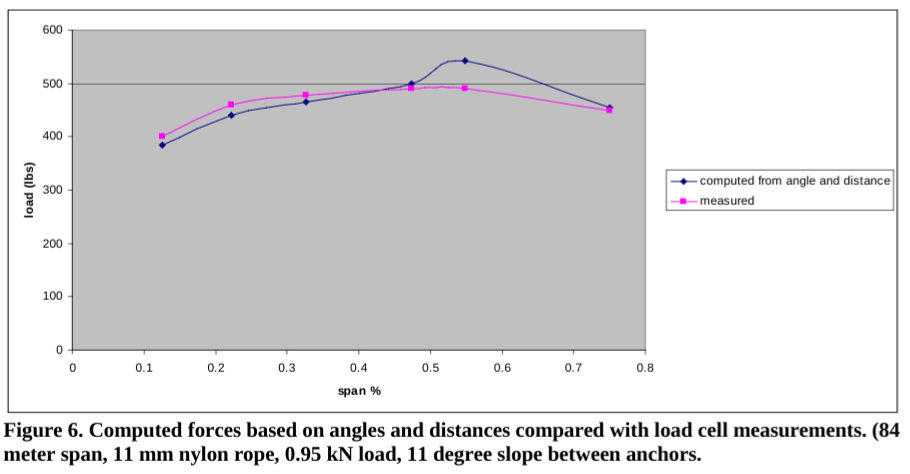
Photo measurements can also be used to estimate the angles and distances in a track line. Once the angles are known, then the forces can be computed as shown above.
Force measurements for the track lines were obtained using a Logi-Cal Boulder, CO, NTSB rated Model LSB110 5000 lb load cell connected to a Salter Brecknell display Model SALTER200E Peakhold. The position of the load along the span was determined using a combination of range finder and photo measurements.
Modulus on the ropes were evaluated on Strike Rescue’s slow pull test machine using a Prince Manufacturing Corp North Sioux City, SD 4 inch bore x 48 inch stroke hydraulic ram #B400480ABACA03B. To measure the modulus of the ropes for comparison evaluation, the Logi-Cal load cell was then connected to Microstrain V-link wireless analog to digital converter along with two opposing analog micrometers, Micro-Epsilon, 94496 Orthenburg, Germany. All data was collected at the same time with Microstrain software Agile-Link v1.3.8.
The predicted deflection of the unloaded rope is shown in Figure 7. The rope deflects 2.5 m from the straight line path. The rope initial length was L0=83.9 m, and the stretch length was L=85.79.
The predicted track line anchor loads and haul load are shown in Figure 8. The anchor loads are the combination of the haul line and the track line loads. The haul line tension can be computed by subtracting the two anchor loads. The track line tension will be the minimum of the two anchor loads. The neutral point is located at a span location of 0.8 along the length. The maximum track line load is at the center of the span. Note that the track line maximum is not collocated with the point where the haul line goes slack.
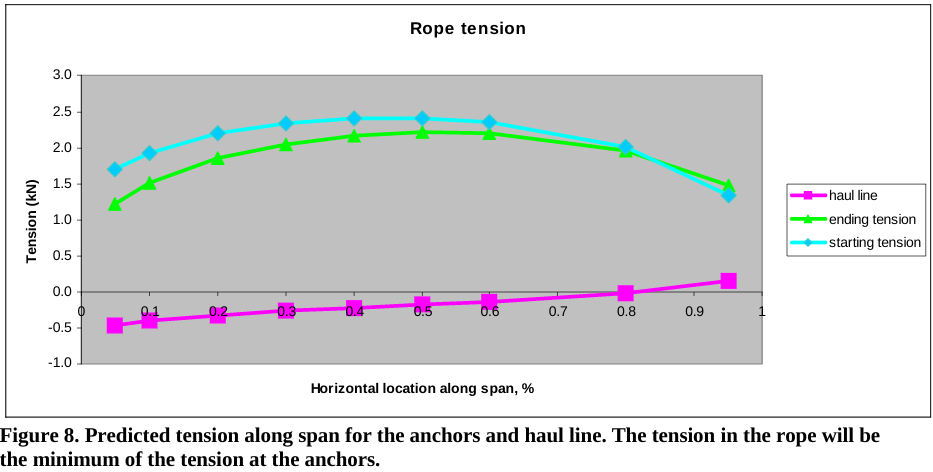
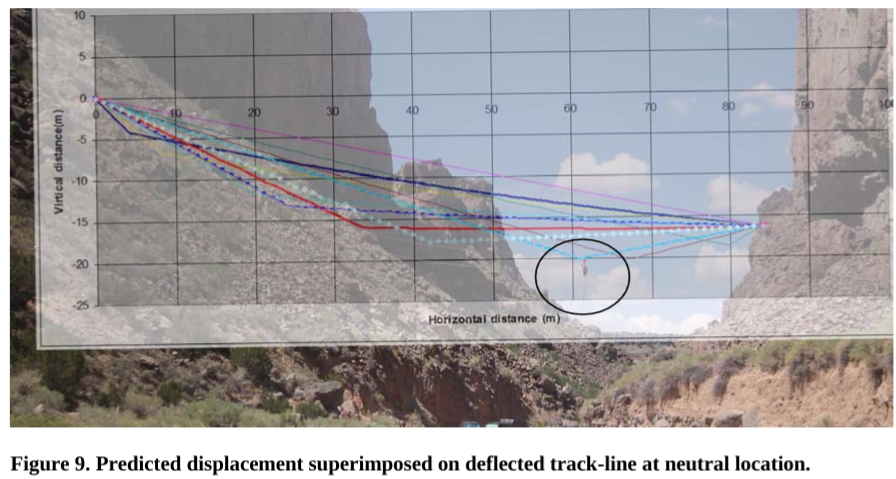
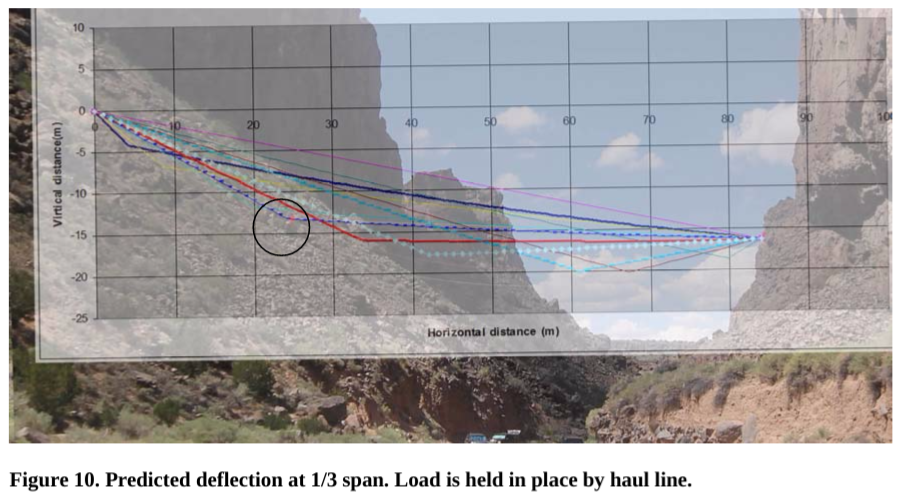
Figure 9 shows the predicted deflections superimposed on the deflected track line geometry when the load is at the neutral location. The agreement is quite good. The load deflects approximately 8 meters from its straight line path. Figure 10 shows the predicted deflections superimposed on the deflected track line geometry when the load is at 1/3 span.
In addition to verification through photogrammetric comparisons, load cells were used to measure the track line tension as the load was moved across the span. Figure 11 shows the predicted load and the measured load for an 11 mm PMI nylon rope. The agreement is quite good. Also shown in this graph is the computed load based on measuring the distance and angle from 1) anchor to the load and 2) anchor to anchor.
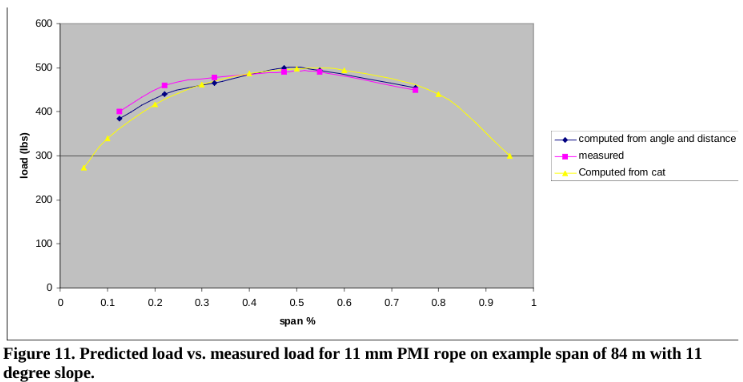
Loads were measured using a load cell on the track line at one anchor. Agreement was within 5% at center of span. Error was larger near the start and end of the span (10%). Likely source of the error was stiffness of the tag line not included in calculations.
While we understand that some error exists in our calculations, we feel that the mathematical model will be useful for track line planning. The mathematical model also allows exploring the conditions where track lines will fail to meet the desired 10:1 static safety factor, or where the predicted deflections will result in a non-functioning track line. Several limitations of the model include the following:
- Rope stiffness will vary with age
- The stiffness of the tensioning system may be important
- The track line system considered assumed that a haul line was supporting part of the load. If the load is “tied” to the track line using a prusik, or a climber is traversing the rope in a Tyrolean, then the track line forces solution presented here will not be valid.
- Only a limited amount of testing at low loads has been used to validate the model
- Other ropes (climbing ropes, slack line webbing) may not follow a second order rope stretch
- Only deflections on loading were considered. We know that once a rope has been stretched, it can follow a different unload tangent. The importance of this load/reload curve was beyond the scope of this paper.
- A second order fit was used to approximate the rope elongation as a function of load. A better approximation may be warranted.
How Much Track Line Preload is Safe?
The mathematical model will now be used to study the recommended rules for track line rigging. In this section of the paper, we will first consider the static safety factors associated with the example problem. We will then show how these factors change as components of the problem varies.
- 11 mm nylon with load .95 kN on 84 m, 11 degree span with .45 kN preload
- Increase the load to 2 kN
- Add 1 meter of slack after pre-tension
- With 2 kN load consider 12.5 mm rope
- Two ropes
- Nylon-polyester ropes
- Pre-tension using 12:1 with no load (a common mistake seen on internet video sites)
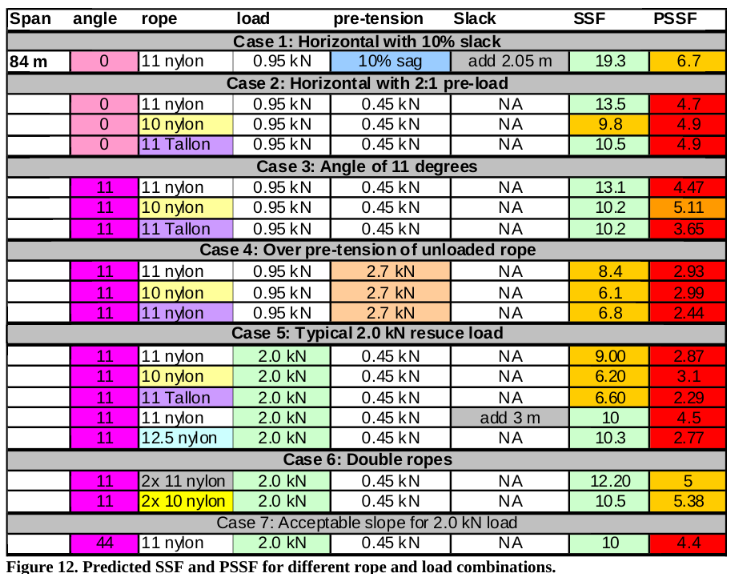
Figure 12 (case 1 and 2) shows the Static Safety factors for a high line constructed with an 11 mm PMI nylon rope loaded with a 0.95 kN load. The model predicts a Static Safety Factor (SSF) for the track line.
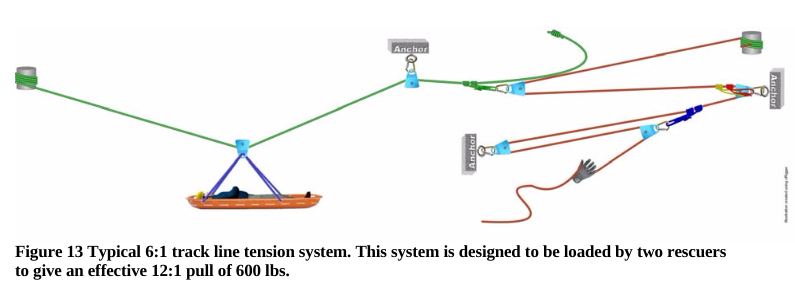
We also included the Prusik Static Safety Factor (PSSF). The rescue community assumes that tandem prusiks will slip/fail at 10.7 kN (2400 lbs), giving a limit of track line tension based on PSSF of 1.07 kN, assuming 10:1 static safety factor. The assumption that tandem prusiks will slip at 2400 lbs and continue to support 2400 lbs has been challenged in the past and will likely need more exhaustive evaluation to quantify this uncertainty. Prusik strengths vary considerably outside of a laboratory setting. However, the margin of uncertainty of prusiks in all configurations remains unknown. We compute PSSF because many published track line rigging designs use tandem prusik knots to secure the track line. (Smith and Padgett, 1996) and (Larson, 1997). Prusiks provide a means to adjust the track line tension once the load is at mid-span. Figure 13 shows a typical track line system that includes prusiks.
The assumption that prusiks will slip before failing may not be a valid assumption. Extensive testing has been performed on tandem prusiks for dynamic belays of rescue loads. Failure testing of prusiks used in track lines has not been published or extensively researched. Frictional damage from prusik slip typically includes partial or full melting of the prusik sheath. In a dynamic belay, prusik slippage may occur when the load is being decelerated. After the load comes to rest, the load is reduced to a lower static load. However, if a track line is overloaded to the point that the prusiks slips, track line forces will not be reduced. The full load must be supported by the damaged prusiks.
The debate regarding whether it is appropriate to use tandem prusiks in track line systems should occur for each team that trains or deploys track line systems in rescues. As part of the debate, we present both the SSF and PSSF for track line forces. The mathematical modeling of track lines in this paper suggests that margins may be very small for assumed tandem prusik strength of 2400 lbs.
One method of track line rigging is to limit the tension by removing slack once the load is in the center of the span. By limiting the post-tensioning load based on a 12:1 rule, the maximum track line force is limited to 600 lbs. While this does result in a 10:1 static safety factor for a track line with a 6000 lb maximum tension strength, it results in only a 4:1 PSSF. While such low static safety factors may in some cases be acceptable risks, using low static safety factors as the norm should be avoided whenever possible, if desiring to stay above a 10:1 SSF.
Conventional wisdom suggests that tandem prusiks grip the rope without compromising their strength. If the system is overloaded, then the prusiks will slip before the rope breaks, adding more rope to the tensioned line and reducing both the angle of the track line and the amount of force on each anchor. Figure 14 shows the track line geometry for a potential overload of a prusik system before and after a “slip”. For the purpose of illustration, assume that the prusiks start to slip at 2400 lbs ( Note that a failure observed during a training by AMRC, tandem prusiks failed at only 1200 lbs). The numerical model predicts approximately 6.2 meters (20 ft) of slip is required to reduce the tension from 2400 lbs to 800 lbs. Assuming an average force of 1600 lbs acting over 6.2 meters requires 44 kJ of energy dissipation. Assuming Cv = 1.67, approximately 120 g of nylon will be melted.
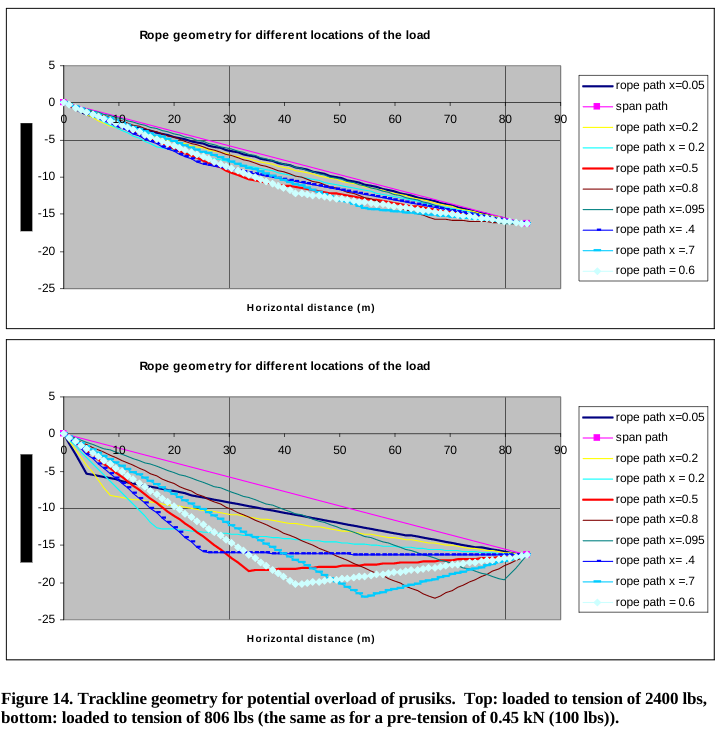
We assert that a well engineered system should perform as expected without unexpected slips. The behavior of an engineered system should be predictable before training starts In some of the scenarios we considered that met the 10:1 SSF for the track line, the PSSF were below 3.
Pre-Tension Rules of Thumb
10% Sag Rule: The 10% Sag Rule states that “For every 200 lbs with 100 feet of span, there should be a sag of 10%” (Vines and Hudson, 1998). The rope sag is the visible sag in the main line before the load is applied.
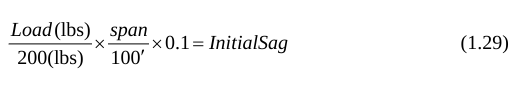
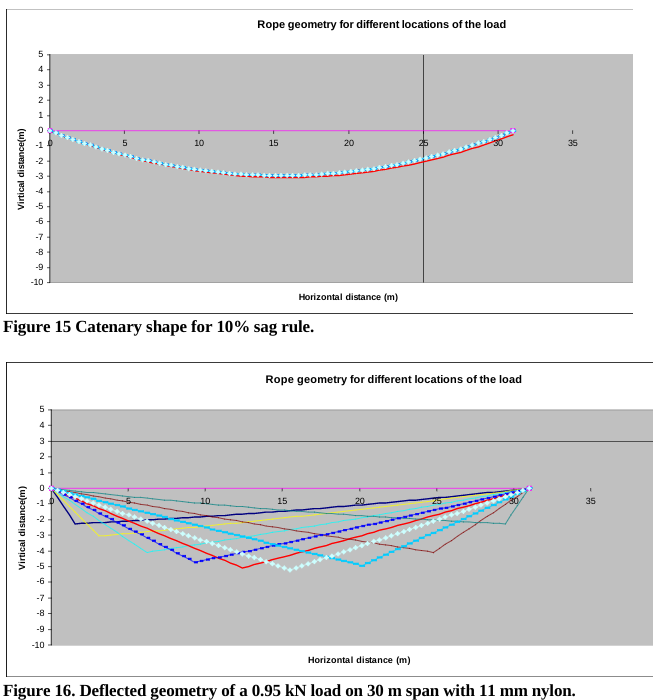
Figure 15 shows the computed catenary for a track line rigged with the 10% rule. The application of this rule to a sloped line is not clear. Figure 16 shows the deformed shape of the track line after for a 0.95 kN load. The SSF for this case was 19.3, well above the 10:1 SSF desired (see Figure 12 Case 7). We conclude that the 10% sag rule is conservative.
2:1 Pre-Tension
The so-called 2:1 pre-tension rule of thumb gives an estimate of the amount of pre-tension that is safe to apply before the track line is loaded. The 2:1 pre-tension rule system employs two people (~100 lbs). This rule is often published without reference to the type of rope used or the amount of load that must be supported with the track line. We found that this rule of thumb works for 11 mm nylon rope and provides a SSF of greater than 10:1 for a 0.95 kN load. (see Figure 12 Case 1&2). Rescue teams often allow loads greater than 2 kN on track lines (rescuer + subject). Use of this method on 10 mm ropes generates a SSF less than 10:1.
The 2:1 system does not meet a 10:1 SSF for a 2 kN load on an 11 mm nylon rope or on an 11 mm nylon-polyester rope. The 2:1 pre-tension system did provide a SSF of greater than 10 for 12.5 mm nylon ropes and for twin 11 mm nylon ropes. The PSSF was below 4:1 for all systems using the 2:1 pre-tension rule.
Simulation can be used to estimate the required extra slack needed that would allow a system to meet a 10:1 SSF. For example, the 2 kN load on an 11 mm nylon rope does not meet a 10:1 SSF. If 3.0 meter of slack is added to the system after it is pre-tensioned using a 2:1, then the SSF is above 10:1. Simulation can also be used to estimate the slack in a system. For example, adding the extra slack in the 2:1 pre-tension rule system will increase the sag from what is shown in Figure 17 to what is shown in Figure 18.
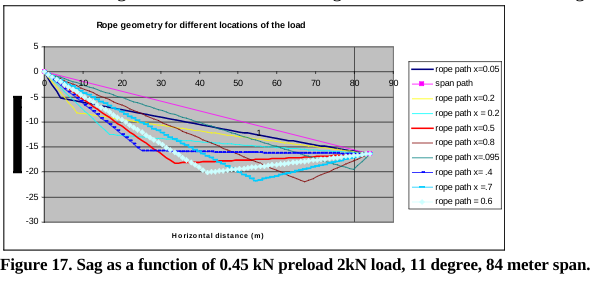
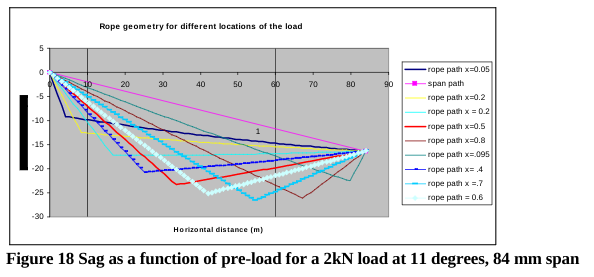
Note that while a SSF of 10:1 can be achieved by adding slack, the amount of sag may make the track line useless, such as with swift water rescue. In addition, the steep angles near the anchors will greatly increase the haul line forces and would require more work to move the load toward the anchors.
Track line tension decreases as the slope angle of the track line increases. If the subject is attached to the track line by ascenders or a tie-off, then increasing track line slope will increase the forces on the high side anchor. At approximately 44 degrees, a 2kN load on an 11 mm nylon track line will have a SSF of 10:1. (see Figure 12, case 7).
Post-Tension Rules of Thumb
Several rules of thumb exist that are based on assuming a 10:1 static safety factor. The so-called 12:1 and 18:1 rule of thumb pulls more tension into the track line after the load is at the center of the span. The tension in the system is controlled by limiting the number of people that can haul on the system:
- 12 people (~600 lbs) for an 11 mm rope (or mechanical advantage equivalent)
- 18 people for 12.5 mm rope
We conclude that this method provides a 10:1 static safety factor when the following constraints are met:
- The load must be in the center of the span
- The breaking strength of the rope is 6000 lbs for 12:1 and 9000 lbs for 18:1
- Friction at the haul point is zero
- The haul line is collocated at the anchor.
There is no way to know before the high line is in service whether the load will be below the 12:1 limit. For example, suppose that the high line is rigged with an unknown but high pre-tension. The very real possibility exists that the tension may exceed the SSF before the load is in the center and the tension is adjusted. Calculations show that the track line forces will be the maximum at the center of the span. The load must be in the center of the span for this method to work.
For a sloping track line, the geometric constraints near the anchor can motivate teams to use the 12:1 limit near the anchors. Limiting the load to a 10:1 SSF near the anchor with a 12:1 rule will work. The load will increase as the load is moved away from the anchor. Consider the case where the 12:1 rule is applied at 10% of the span length and the load as it is moved to the center without relaxing the load. This error would result in 23% increase of the track line tension when the load is moved to the center of the span.
Confusion exists for the 12:1 and 18:1 rule. For example, Guidelines for Rope Access Work, U.S. Department of the Interior, Technical Service Center, 2004 states:
“Based on empirical testing, the average person exerts about 100 lbs of force when pulling with a gloved hand and moderate effort. For 11mm (7/16″) rope in order to maintain about a 5:1 system safety factor, it is recommended to limit the load to 1200 lbs of force, or 12 people. For 12.5 mm (1/2″) rope the factor is 18 people or 1800 lbs.”
If prusiks are used as part of the above system, then a PSSF of less than 2.0 will exist. Since dynamic loads of 1.6X to 2X are typical, we would expect prusik slippage with subsequent damage on systems rigged using the above guidelines.
Several web-based videos incorrectly instructed that the 12:1 tension of the track line should be applied as pre-tensioning before any load is added to the track line. This will result in a static safety factor below 6 for a 0.95 kN load. If a 12:1 preload is used with a 2.0 kN load, we would then expect prusik slippage and subsequent damage (see Figure 12 Case 4).
Recommendations
Prusiks should not be used to anchor track lines. Figure 19 shows potential alternatives to using prusiks for anchoring track lines. A bollard constructed from a large diameter pulley with locking pins will provide a full strength interface to the track line. The Grigri has also been shown to provide a full strength tie off when backed up with a stopper knot. The tensioning system still includes prusiks, but the load in the prusiks is reduced when used in a mechanical advantage system.
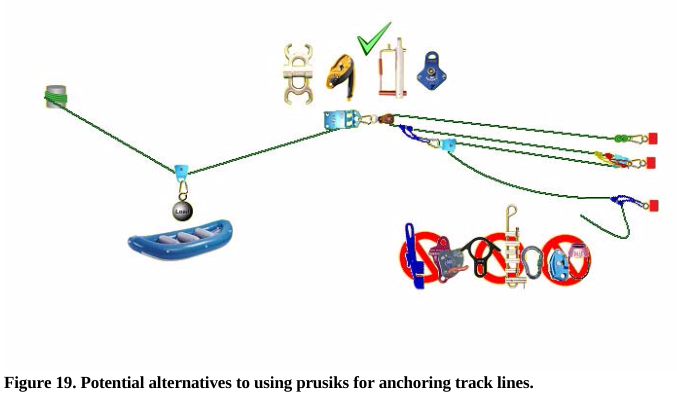
Additional testing and research is needed to explore the best options for adjustable full strength tie offs. Care must be taken to ensure that the system static safety factor is based on the weakest link in the track line anchoring system.
Summary
A mathematical model of track line behavior was developed based on a point loaded catenary with a non-linear rope stretch. The mathematical model was validated with limited testing using loads and spans that are typical of track lines seen in rescues. In general, the computed forces and deflections were in good agreement (within 10%) of the measured observations. While this numerical model is known to be incomplete, it was useful for understanding the behavior of track lines.
The track line model was used to test the traditional rules of thumbs for track line pre-tension and post-tension. In general, we found the traditional rules of thumb work, providing their limits were met.
Some notable exceptions to the rules of thumb not satisfying a 10:1 SSF:
- Loads of 2kN on rope sizes below 12.5 mm with angles less than 45 degrees
- Prusiks as part of the track line system while in use
- Improper pre-tensioning
The hypothesis that a prusik can act as a clutch by slipping to reduce the track line load requires the assumption that a prusik can slip under load for several (>3) meters without excessive damage to the prusiks or the main lines.
The ability to compute and visualize track line sag as a function of load will be valuable for track line training and essential in real-time decision making during rescues. More testing is needed to understand the limitations of the mathematical model presented in this paper.
Acknowledgments
The authors would like to express their gratitude to PMI and in particular Loui McCurley for her encouragement for this work, and her support of ITRS.
References
- Attaway, S., Weber, C. “Analysis of Rope Impact Force Equations Predicting Rope Impact Forces, ITRS 2002, Fort Collins, CO.
- Smith, B, and Padgett, A, On Rope, New Revised Edition, 1996, National Speleological Society, Huntsville, Alabama.
- Vines, T, and Hudson, S, High Angle Rescue Techniques, 1998, The National Association for Search and Rescue, Kendall/Hunt Publishing, Dubuque, Iowa.
- Setnicka, T., J., Wilderness Search and Rescue, Appalachian Mountain Club, February 1981.
- Stiller, J., “When Prusiks go Bad, or Are your Sure That Thing is Gonna Hold?”, ITRS, Oct. 20-22, 2000, Tucson, Arizona.
- Stiller, J., “Tandem Prusiks, Is no news good news?”, ITRS 2005, Fort Collins, CO.
- Guidelines for Rope Access Work, U.S. Department of the Interior, Technical Service Center, 2004.
- Larson, A, “The Kootenay Highline System, Rigging for Rescue, Notes, 1997. Ouray, CO. Liengame, B.V., A Guide to Microsoft Excel for Scientists and Engineers, Arnold, London, 1998.
- Anderson,S.H., “Tensions in Track Cables and Logging Skylines, The Catenary Loaded at One Point”, Bulletin No. 13, University of Washington Engineering Experiment Station, June 16, 1921.


13 thoughts on “From Stephen Attaway for ITRS: Track Lines and Guiding Lines: Forces Based on Point Loads in a Catenary”
Very interesting and impressive! Quick question:
Shouldn’t it be “alpha MINUS gamma” instead of “alpha PLUS gamma” in (1.8) and (1.9)?
Also the definitions and meanings of F1 and F2 respectively would be helpful (for tag lines in both directions, depending which one is under load?)
Thanks!
I couldn’t resist commenting 🙂
Thanx for the effort, keep up the good work Great work, I am going to start a small Blog Engine course work using your site I hope you enjoy blogging with the popular BlogEngine.net.Thethoughts you express are really awesome. Hope you will right some more posts.
Way cool, some valid points! I appreciate you making this article available, the rest of the site is also high quality. Have a fun.
776755 137499really nice post, i certainly enjoy this remarkable web site, persist with it 833200
Greetings! Very helpful advice within this article! It’s the little changes which will make the biggest changes. Many thanks for sharing!
WONDERFUL Post.thanks for share..extra wait .. …
77198 540968Informative Site Hello guys here are some links that contains data that you may possibly uncover helpful yourselves. It is Worth Checking out. 891604
A round of applause for your blog.Really thank you! Really Cool.
635831 483899Largest lover messages were made to share it with your and gives honour with the bride and groom. Very sound systems facing unnecessary throngs of individuals really should take into account each of our valuable concept of all presenting, which is ones trailer. best man toasts 18720
400797 127705Its always excellent to learn guidelines like you share for weblog posting. As I just started posting comments for blog and facing difficulty of lots of rejections. I think your suggestion would be beneficial for me. I will let you know if its work for me too. 214521
139949 106549It can be tough to write about this subject. I feel you did an excellent job though! Thanks for this! 636641
Very counsel you to see a website that has a lot of information on the topic interests you.
Comments are closed.